Having problems getting your product to rank on marketplaces? It can be a time-consuming and difficult process to make sure you have the right keywords in your title, description, and features so that shoppers can find your product. The process doesn’t have to be so hard!
Now it’s easier than ever to get your products seen. Leverage AI-driven tools to build better listings that will help get your products found faster than ever before with improved ranking scores.
Sellmatica has developed the Listing Analysisβ and the Listing Builderβ features that offer solutions for all of these problems and more to help you save time and rank higher in marketplace searches. Let Sellmatica do the work for you and see what a difference data-driven listing optimization technology can make!
Learn more to learn how Sellmatica can help you sell smarter and amp up your sales game.
Explore customer behaviour on marketplaces that boost sales
As a marketplace seller, you might not always have access to your buyers’ information, let alone your potential buyers. But don’t worry, there are ways to unlock that and use it to your advantage when launching a new product or improving your existing listing! Let’s explore together.
Action Steps
- Explore engagement metrics…discover what’s working!
- Run reports to collect valuable insights.
- Use insights to elevate your listings and boost performance.
Engagement Metrics: Your Customer Insight Tools
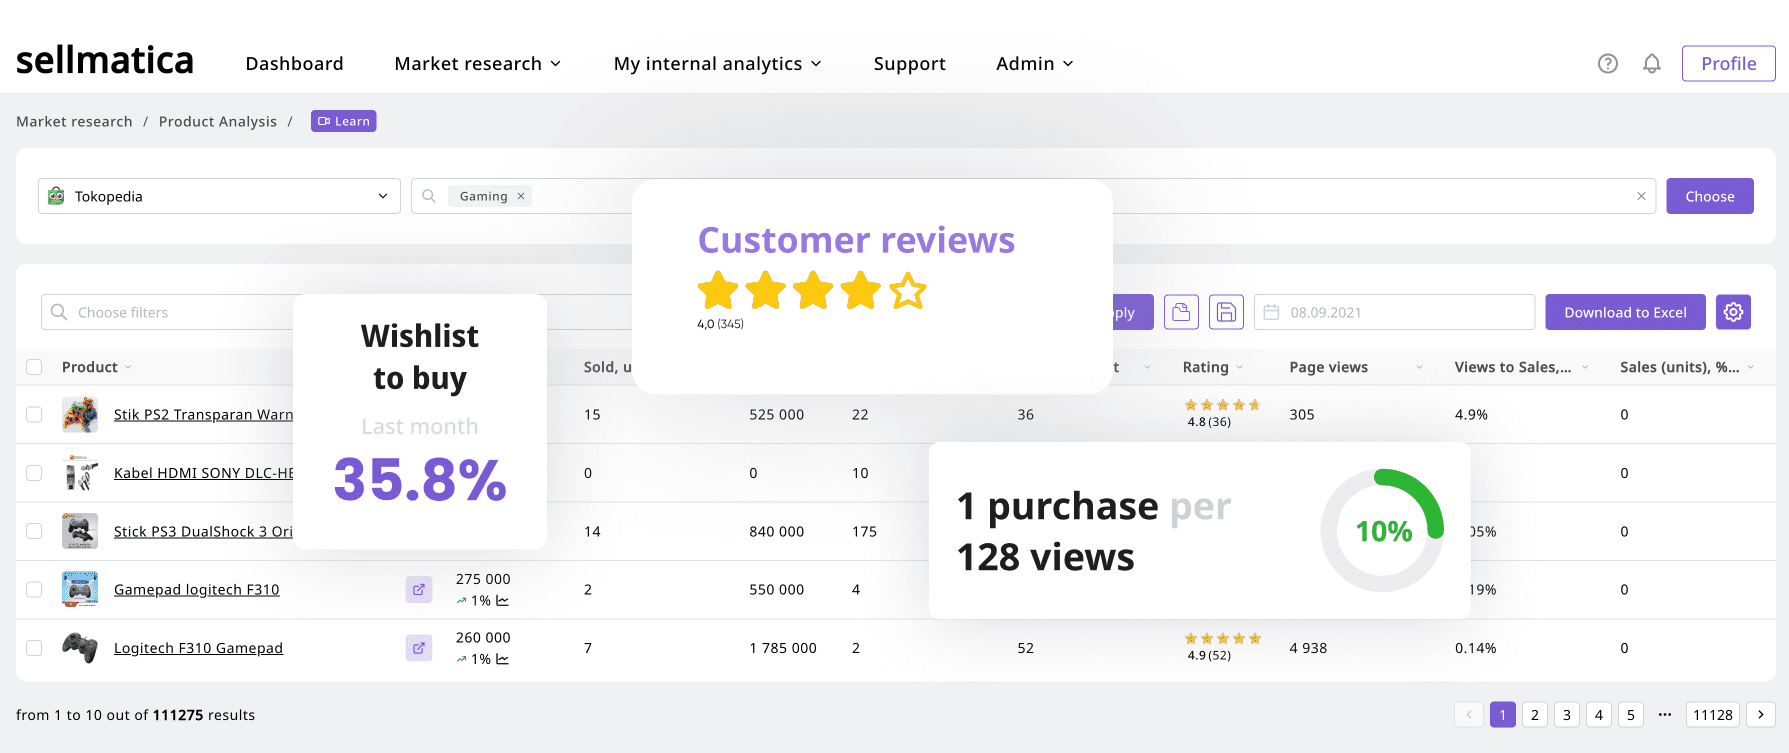
Discovering your customer’s buying behavior patterns can be easier than you think. The best metrics to uncover customer behaviors are often within reach – reviews given, questions asked, and the knowledge gems hidden within them.
But there are other equally revealing indicators that may not be as obvious. By using strategic metrics such as view-to-buy (purchases/views) or wishlist-to-buy (purchases/wishlist additions) ratios, you’ll gain insight into their decision-making process.
With these insights, you can craft copies that engage and convert! Keeping an eye out for these nuggets of insight will come in handy for perfecting your copy for listings and increasing conversions!
Here is a case study of one of our clients. They operate in a fiercely competitive niche where sellers understand the importance of ratings, reviews, pricing, and delivery options. As the client struggled to differentiate themselves, they began to focus on their listings. To achieve this, they conducted an in-depth analysis of engagement metrics, consisting of indicators such as view-to-buy and wishlist-to-buy, among others. As it turns out, these can provide valuable insights on buyer behavior. This is how it was used in this case
- Low ratio: When you observe a lot more views than purchases, it suggests interest in the listing. However, something may be hindering the purchase process. This could be due to pricing, stock issues, negative seller reviews, or subpar copy. The client realized that despite the key indicators being fine, the copy used by their main competitors in the listings wasn’t compelling enough.
- High ratio: A listing with a high view-to-buy or wishlist-to-buy ratio can provide valuable insights to learn from. However, it is important to not jump to conclusions as it could also indicate impulsive purchases without much deliberation. Remember, there could be other underlying factors that could explain the ratio. The client chose to first increase their ratio and then launch an ad campaign to further augment their sales.
This approach proved highly effective, propelling our client to the top position by revenue within their niche in just three months.
However, this scenario was exceptional. If you’re not currently facing significant pressure in your market, consider beginning by analyzing the number of reviews, rating, page views, questions, and wishlist additions. By focusing on these factors, you can effectively gauge your product’s performance and devise a strategy to improve it accordingly.
Discover the unseen with Sellmatica’s reports
Great! Now that you know which metrics are necessary for formulating your strategy, you may be wondering: do you have the time to collect and calculate all of the data? The answer is simple: you don’t have to. Our suite offers a plethora of external reports that contain ample amounts of valuable data, and these serve as an excellent launchpad for deeper insights:
- Category Analysis: Discover benchmarks specific to your category or niche. For instance, you may observe that typical listings in your category display only one image, and have a wishlist-to-buy ratio close to zero. Even without an in-depth analysis, the potential for improvement here is apparent.
- Product Analysis: Examine successful and unsuccessful product cases to determine view-to-buy ratio and sales correlations. Compile a list of items for further analysis, using additional reports such as Listing Scanner to identify best practices.
- Trend Analysis: See the market trends. To avoid launching or maintaining a product in a declining market, it’s crucial to track sales and revenue fluctuations through trend analysis. By doing so, you may notice a disconnection between sales, revenue, or other essential metrics and user engagement metrics.
By delving into these reports, you might chance upon fascinating insights that can elevate your sales on marketplaces. Plus, you can save loads of time and effort. Lots of sellers spin their wheels on things that don’t really get them anywhere. But with a subscription to Sellmatica’s reports, you can dodge those costly mistakes and put your energy where it counts.
Listings: Transform buyer insights into actions.
Suppose you, as our client from the example above, found that you could use engagement insights to improve your listings. Then what? Here are several ideas of how you could take advantage of knowledge on shopper behaviour to benefit your business.
- Planned Purchases. Look for high wishlist-to-buy ratio. A low Wishlist-to-buy ratio could be a good indicator for a spontaneous purchase, because the buyer usually decides to buy the product on the spot without saving the listing for the future. For spontaneous purchases, opt for a direct call to action that prioritizes an immediate purchase. However, for planned purchases, emphasize the benefits crucial to your buyer and spotlight your product features. In these cases, consider gently nudging them to add your product to a Wishlist or a cart for future consideration.
- Purchase Seasonality. Look for high view-to-buy ratio. Identify patterns in your customers’ purchasing behavior. For instance, if there’s a notable spike in purchases just before the new year, use this insight to adapt your copy accordingly and distinguish yourself from competitors.
Conclusion
We’ve traversed through the essentials of understanding your customers’ behaviors, the value of metrics like view-to-buy and wishlist-to-buy ratios, and how they can influence your sales strategies. Coupled with the power of Sellmatica’s comprehensive reports, you can tap into rich insights that allow you to optimize your listings effectively and stay ahead in the competitive marketplace.
Remember, each piece of data, each customer interaction, and every review on your product listing carries within it a story about your buyer’s journey. With careful analysis and the application of these insights, you can write your own success story by tailoring your sales strategies to match your buyers’ needs and behaviors.
The journey doesn’t end here! There are countless insights and opportunities waiting to be discovered. With Sellmatica by your side, your potential for growth knows no bounds. As we continue to innovate and evolve, we urge you to do the same with excitement and practicality.

At Sellmatica, we believe in providing the absolute best tools to help our customers succeed. Sign-up to see firsthand how Sellmatica can help your business reach its goals.
Listing Analysisβ and Listing Builderβ – beta versions available for selected users